
How can “Customer Perceived Value” (CPV) Inform the Customer Experience of HR?

Net Promoter Score (NPS) has established itself as a leading measure of the customer experience and is one that has been adopted by many companies since it’s introduction by Fred Reichheld in his 2003 article for the Harvard Business Review “One number you need to grow”.
The concept suggested by NPS of customers as ‘promoters’ or ‘detractors’ is initially appealing, and one can see why a generation of business executives picked NPS as their engagement tool of choice. After all, who wouldn’t want a customer eagerly promoting your product for you? It was so successful that it was soon adopted by related disciplines too, such as HR, where promoters were now promoting the company as a place to work.
So far, so good, but organisations adopting NPS can encounter some puzzling behaviours. Common observations are:
1) The overall average score varies little
Whenever you produce an aggregate metric score, be it for the last year, over all products, including all territories, etc. You tend to get an average score that is all but constant, and hardly varies over time. For NPS it might be in the region of +20%, but the overall average score is resistant to change and rarely moves much, whatever the impetus.
2) Some groups of people always give higher scores than others
Often initially mistaken for pockets of excellence, or troubled areas in need of improvement, these differences turn out to be consistent. Low scoring groups always tend to give lower scores than other groups, whatever the situation (good or bad)
3) Failure to correlate
It is intuitive to expect higher scoring to correspond with positive events, such as a new product launch, a S/W update, or lower levels of churn. Similarly, we’d assume that more challenging times might result in lower performance. Sadly, our intuition tends not to tally with reality, and analysis conducted over a four-year time span revealed no consistent relationship between real-world events and NPS.
Despite being based on direct feedback, these three observations lead us inevitably to the conclusion that the metric is not telling us precisely what we thought it was. We are thus forced to conclude that something fundamental must be amiss for these three traits to be so ubiquitous.
One can think of a survey-based measurement like NPS as consisting of three generic steps:
a) Question
b) Response
c) Calculation.
For our three observed traits to be explained, something must be going awry with one or more of these steps. Investigation unearthed problems with all three of them.
For the question (step a), a survey might ask a question which elicits a response, but is the respondent truly reflecting upon the question before providing a considered response? Research has shown how humans confronted with a complex or compound question tend to extrapolate from the actual question asked and substitute a related, easier to answer, question instead. The response given is a response to the simpler ‘surrogate’ question.
The standard question used for NPS, “…how likely are you to recommend …?” is a compound and complex question. In practice, we find ourselves in a situation where we actually recommend a product or a company infrequently. It rarely comes up in conversation, and if it does, the number of variables in conversation (how well you know the other person, is the discussion public or private, are you at a party, do you know the host) are almost infinite.
When challenged in interviews, survey respondents who had happily provided an answer to a “recommend” question couldn’t clearly explain the circumstances under which such a recommendation would actually happen. Mood, personality, the nature of the social and professional relationship, all these had to align before a recommendation was either sought or given. This finding was true across the world, and true whether the individual was a promoter, a passive, or a detractor.
In short, the NPS “… likely to recommend…?” question will most likely elicit a response to a surrogate question, such as how they feel about a product’s quality or a company’s general performance. They are not likely to man the barricades or reach for a megaphone (though this behaviour does have predictors). They were answering a different question.
Interested in learning more about Employee Experience? Take a look at our online Digital HR training courses on myHRfuture
Survey responses (step b) are also problematic. Looking at a set of responses to a single survey and analysing them geographically, one will find that average responses from certain demographics are higher than others, implying areas of higher promotion, or a better customer/employee experience. What is interesting is that these differences are persistent. Certain areas always see higher scoring, and others always tend to give lower scores. With data over multiple surveys, and questions designed to guarantee responses for a balanced set of respondent experiences, this effect is fully quantifiable. For an equally rich set of experiences, different demographics produce tangibly different ranges of surveys scores. This well documented effect is called “Culture bias” and it plagues any survey whose scope extends beyond a single company or cultural group.
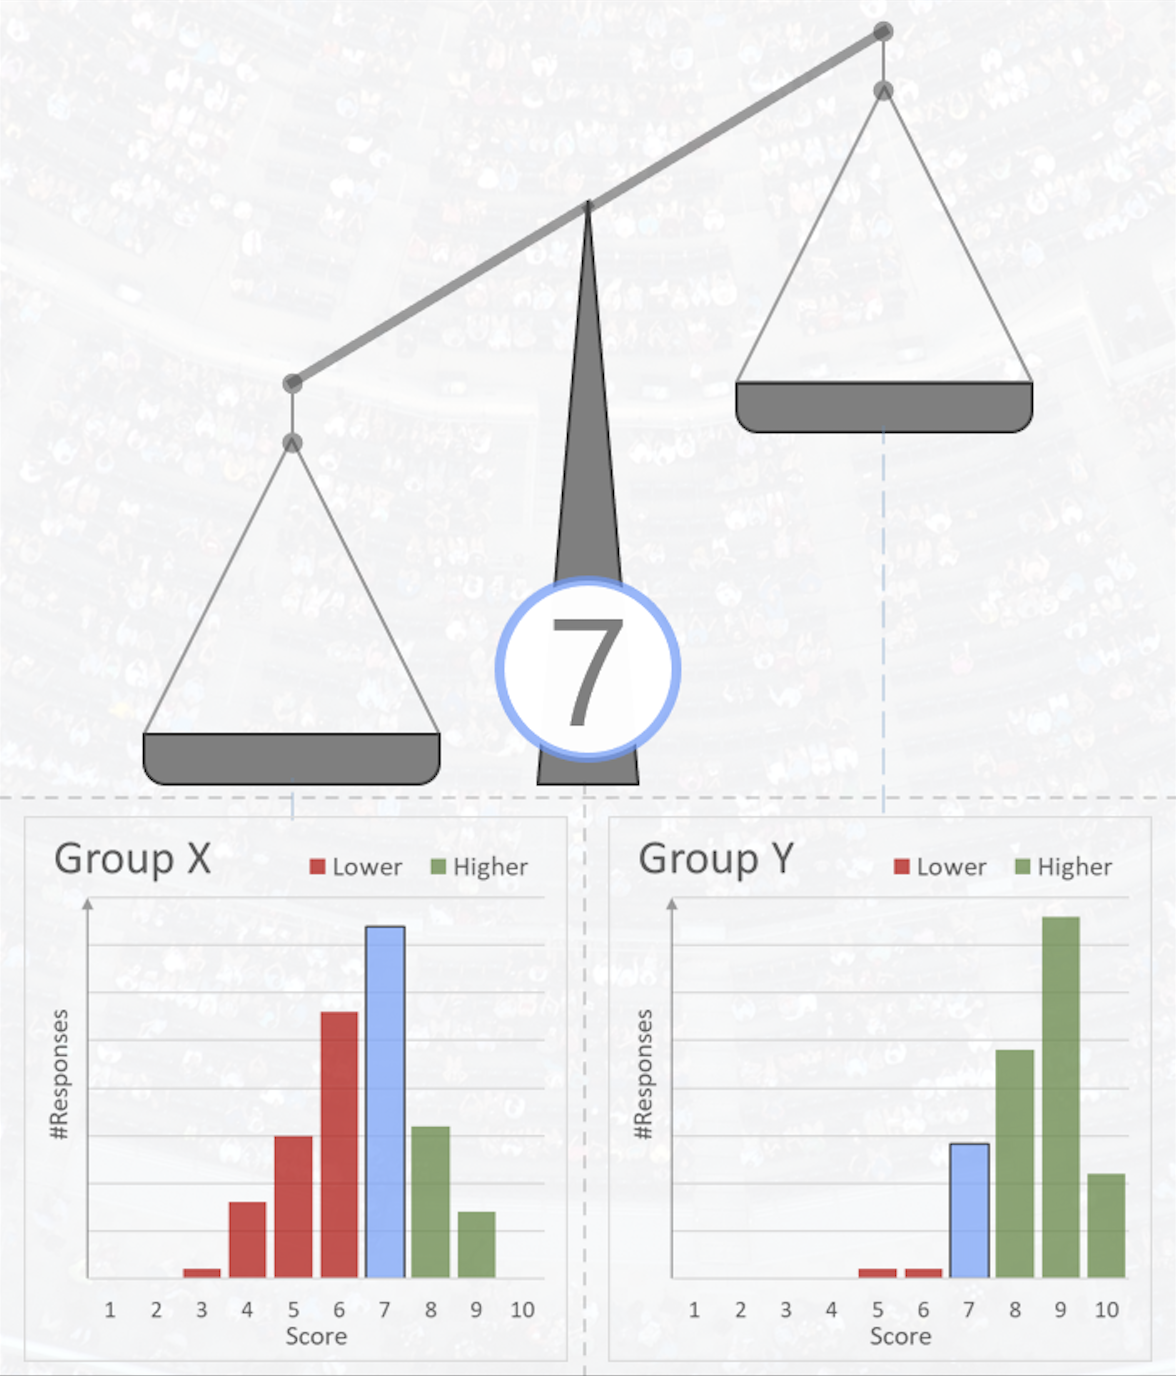
If we consider a survey scale from 1 to 10, then one would assume that an average score would be a 5, and that scores of 1, 2 or 9, 10, would be rare and, thus, indicative of extreme views or experiences. In practice these assumptions turn out to be false. On such a scale, a global average score across many surveys and locations would be just slightly higher than 7. Scores of 1 & 2 might well be rare, but 9 & 10 occur quite frequently. What is crucial is that a score of, say, 7 means something different when received from different groups of people. For some demographics, most historic scores are greater than a 7, so to receive a 7 implies a particularly poor result. For others the majority of scores are less than a 7 and, for such groups, the award of a 7 is a positive sign.
The Culture bias effect is persistent and occurs whichever scoring scale is used, regardless of whether colour coding or iconology is used to ‘guide’ the scoring behaviour of the respondent. NPS uses a rating scale that goes from 0 to 10. Scores of 6 or below are called ‘Detractors’, a score of 7 or 8 are ‘Passives’, whilst those who award a 9 or a 10 are called ‘Promoters’. Clearly the NPS rationale faces a problem when a score of 7 can mean different things depending on which cultural group awarded it. Is a 9 really a ’Promoter’, or just a response from a high scoring cultural group?
The fact that a survey score can mean different things when awarded by different cultural groups is also a serious consideration for the calculation of the metric (step c). NPS = [%Promoters - %Detractors] and this equation produces a figure between -100% and +100%. As we’ve seen, the ‘percentage of Promoters’ might well just be the ‘percentage of respondents from groups that tend to award higher scores in a survey’. How can NPS be a measure of the degree of promotion when the value is so dependent on who we ask?
These issues were addressed in Nokia’s customer experience metric: “Customer Perceived Value”. Survey questioning directs the respondent to consider competitor performance too, ensuring balance and context in their responses (correcting issues in step a). CPV incorporates a bias correction algorithm that compares each survey response to a prior record of scoring from that group, to deduce its relative meaning (addressing problems with step b). The metric calculation itself uses bias corrected responses to a set of questions in order to zero in, GPS like, to an accurate overall measurement (step c). The result is a relative measure of the customer experience that is comparable across time and location and does not elicit the three traits observed in NPS, noted earlier.
The beauty of the Net Promoter Score approach cannot really be challenged, and the tripartite view of Promoters, Detractors, and Passives seems to easily resonate with the intuition of many business leaders. The narrative of converting Passives into Promoters, is an attractive one that appeals because of the control it implies over an otherwise complex and intractable area. Sadly, the reality is less elegant. Clearly there are still instances where NPS is an appropriate measure, but it is most suited to simpler scenarios where advocacy is an all pervasive and dominant consideration.
The Perceived Value approach has its own elegance. Humans, we discover, assess any new experience by comparison with some other experience, that of the previous year, that of a competing company, that of another product. Designing context into our questioning forestalls respondents from seeking their own (possibly inappropriate) reference points. The bias correction approach matches metric mathematics to the naturally evolved human process it is attempting to measure. When we pause to consider all we’ve learned, we realise something quite profound: All perceived experience is relative.

Build the Digital HR skills you need
The myHRfuture academy is a learning experience platform for HR professionals looking to invest in their careers. Our online training helps HR professionals to become more digital and data-driven and build the skills you need for the future of HR. The myHRfuture Academy provides you with an on-demand platform where you can get access to over 500+ pieces of short, bitesized learning content all expertly curated to help you build knowledge in People Analytics, Digital HR & HR Technology, Design Thinking, Workforce Planning, Consulting & Influencing and Stakeholder Management. Sign-up today for unlimited to access to myHRfuture for only £25 per month.
ABOUT THE AUTHOR
Phil Mercy works for the Quality organisation in Nokia, based in the UK. He was awarded a six-sigma master black by Motorola in 2009, and holds a degree is in Electronics & Electrical Engineering from the University of Birmingham, UK. Starting his career in Design, he gravitated towards mathematical modelling and analytics taking on multiple global projects and programs as NSN focussed on differentiating with Quality. He is currently focussed on quantifying the customer experience, and the analytics of the underlying drivers behind business success. A 56 year old card-carrying member of Mensa, Phil lives with his wife, Amy, in Watchfield, UK. Phil loves rambling, is fascinated by pre-history, and plays guitar for a moderately successful progressive rock band.
Mark Hayton is the Global Lead for Organization Development Analytics at Nokia. In this role Mark provides proactive and reactive frameworks for executives and HR practitioners that map out employee perceptions across the employee life cycle. Drawing from a knowledge base of behavioral psychology, microeconomics and game theory, Mark is an advocate of rolling up the sleeves and digging deep into the data to find broad impact interventions for those who can’t see the woods for the Decision Trees or define significance in decimals rather than P values. A fan of Stats, Bots, AI, ML, 'nudges' and consultation, his role in Nokia’s most recent transformation is to help HR practitioners understand, focus, support and motivate where it matters most while walking the line between the benefits of people analytics and the uncertain data privacy environment. A firm believer in human-centricity and that people don't think as much as they think they think.